Your dashboard can be arranged according to which portlets you would like displayed each time you login to your Enquire account. The system stores your preferences so that they are maintained and your home page remains consistent. These preferences can be edited at any time.
| Dashboard Settings |
| Add Portlets |
| Organise Portlets |
| Dashboard Factsheet PDF download 268KB |
You can change the colour display (theme) of your dashboard.
1. Select the cog icon in the top right hand corner of your home page.
2. Select the Theme you want to use.
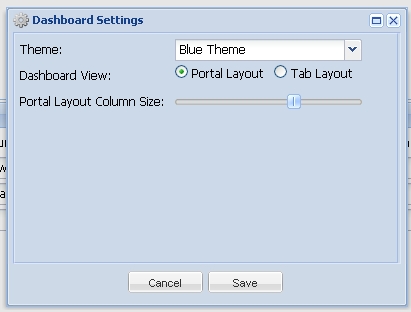
3. Select the View you would like to be made available. There is the portlet view or tabular view.
4. Identify how you would like your portlet view arranged. The dashboard can be split into two columns so portlets can be arranged left and/or right. Alternatively you can use one column only if preferred. Use the Portal Layout Column Size slider to create the correct size of columns. e.g Left Column 50% | Right Column 50%.
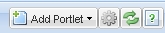
1. Select the Add Portlet button from the right hand corner. This can only be accessed from your Home page.
2. Select the type of portlet you want to display. This will bring up various options that fall under this type. There are several types of portlets indicated by the icon beside each name (table, pie graph, bar graph and chart).
.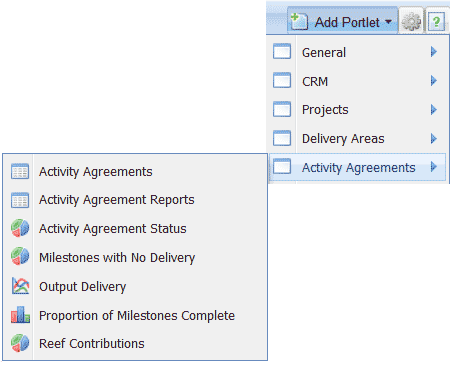
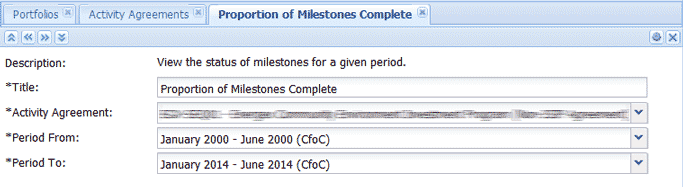
3. Select the portlet. You will be required to configure the displaying data. Select from the available options then Save.
4. The portlet will then display within your dashboard. Portlets can be removed at any time by using the x button in the top right hand corner or in Tab View, the x button next to the tab's name. Select Yes when prompted to confirm the removal of the portlet.
Note: To save portlet settings in Enquire, select log out upon exiting.
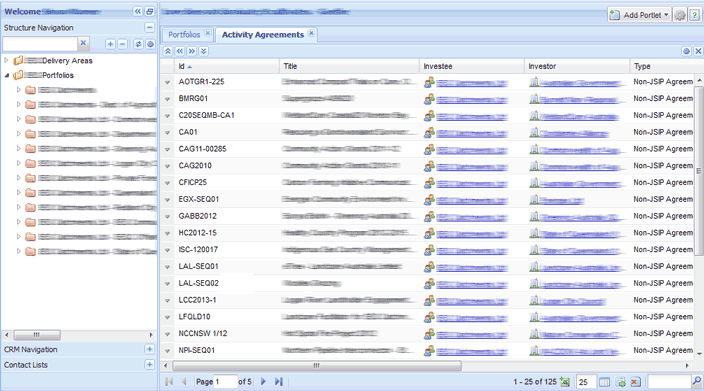
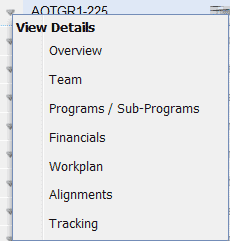
Some objects within the portlets have additional quicklink menus. For example, the Projects portlet. These objects will have an arrow in the row beside them. Select from the drop down menu to navigate to a specific area of the object.
The buttons within the banner of each portlet, help you manage the particular portlet by providing options to move, close and organise the content.
| Top Left | Top Right | ||

|
Move the current tab to the first place in the tab list |

|
Collapse the portlet to hide content (Portlet View only) |

|
Move the current tab left by one place in tab list |

|
Refresh the portlet |

|
Move the current tab right by one place in the tab list |

|
Open the setting page for the portlet |

|
Move the current tab to the last place in the tab list |

|
Open the portlet in a window (Portlet View only) |

|
Close the portlet and remove it from the dashboard |
|
Close the portlet and remove it from the dashboard |
The buttons at the base of tabular portlets have extra functions, such as exporting information to an Excel spreadsheet.
| Button | Description |

|
Navigate between the pages displayed |

|
Export portlet results to Excel |

|
Rearrange column order |

|
Force fit columns to fit view |
|
|
Set custom settings for portlet to default |
|
Filter portlet results with text |
At the bottom of pictorial portlets, there are additional options for display and export.
| Button | Description |

|
Display title on graph |

|
Display legend on graph |

|
Display titles on pie charts |

|
Export portlet as image. The default image type is PNG but JPEG and GIF formats are available. |
If you have set up your portlet page into two columns, all the portlets are automatically placed in the left one. Drag and drop your portlet into the required column i.e left or right.
You can choose which columns display within the portlet. Select the arrow within any column, this will provide a drop down menu, select the Columns area. Select the checkbox/es of the column you wish to display within the portlet.
